

Technology Stock Analysis, Price Tracking & Company Financials
Technology stock analysis brings share prices and company financials into one view. A useful review asks what a company sells, whether sales turn into profit and cash, what investors pay for those results, and how much risk the stock may add to a portfolio.
This guide compares eight US-listed technology companies: Microsoft, NVIDIA, Broadcom, Taiwan Semiconductor Manufacturing, Apple, ServiceNow, Palo Alto Networks, and Texas Instruments. It includes a dated price snapshot, trailing financial measures, valuation ratios, and a simple tracking method. These companies are research examples, not buy recommendations or promises of future gains.
Eight Technology Stocks to Analyze
The companies below were selected to represent different business models. To qualify for this shortlist, each had positive trailing operating profit and positive trailing free cash flow in the comparison data available for this review. Each also had public financial reports and a US listing or US depositary receipt. The screen did not prove that any stock is cheap or safe.
| Company | Ticker | Main business | Question to research |
| Microsoft | MSFT | Software and cloud services | Can AI revenue support the cost of new data centers? |
| NVIDIA | NVDA | AI computing systems | Can customer demand and high margins last? |
| Broadcom | AVGO | Semiconductors and infrastructure software | How much future growth depends on AI spending? |
| Taiwan Semiconductor Manufacturing | TSM | Chip manufacturing | Do the price and business justify factory and geographic risks? |
| Apple | AAPL | Devices and services | How much growth is already reflected in the share price? |
| ServiceNow | NOW | Enterprise workflow software | Can subscription growth keep turning into cash per share? |
| Palo Alto Networks | PANW | Cybersecurity | How much growth comes from current products and customers? |
| Texas Instruments | TXN | Analog and embedded chips | Will factory investment earn enough over time? |
The screen favors positive cash generation and several business models. It excludes private firms and companies with negative free cash flow. That is a scope rule, not a judgment that every excluded company is poor.
Dated Valuation and Cash Flow Comparison
The following snapshot uses the October 2, 2026 market close. The data provider updated its statistics on October 3. TTM means trailing twelve months, or the latest twelve months of reported results. Fiscal periods differ by company. Figures are rounded and have not been recalculated as fair value estimates.
| Company | Trailing P/E | Price to free cash flow | TTM free cash flow, USD billions |
| Microsoft | 28.83 | 57.37 | 66.99 |
| NVIDIA | 29.58 | 44.48 | 127.01 |
| Broadcom | 45.33 | 43.02 | 39.40 |
| Taiwan Semiconductor Manufacturing | 29.21 | 56.63 | 35.94 |
| Apple | 38.28 | 35.63 | 136.68 |
| ServiceNow | 83.96 | 30.33 | 4.58 |
| Palo Alto Networks | 1,074.43 | 80.20 | 4.11 |
| Texas Instruments | 44.63 | 50.10 | 5.36 |
Source: StockAnalysis company statistics pages, with provider data identified as S&P Global Market Intelligence. Each company row should link to its own statistics page: Microsoft, NVIDIA, Broadcom, TSMC, Apple, ServiceNow, Palo Alto Networks, and Texas Instruments. Figures are a dated snapshot, not live quotes. Refresh them before publication and whenever the page is updated.
The P/E ratio compares a share price with earnings per share. Price to free cash flow compares market value with cash left after capital spending. A lower number does not prove a stock is undervalued.
For deeper comparisons, technology stock analysis and company financials belong together. The same sales growth can produce very different cash and valuation outcomes.
Palo Alto Networks has a very high P/E in this snapshot because its reported earnings are small compared with its market value. That ratio can move sharply when earnings change. ServiceNow also has a high P/E, while its price to free cash flow is lower. These differences show why investors should read more than one measure and understand how each company earns money.
Technology Stock Prices at the October 2 Close
This dated snapshot uses the US market close on October 2, 2026, and is not a live quote. Prices and daily changes are from StockAnalysis. Year-to-date return is price return, excluding dividends. The 52-week range is a past trading range, not a forecast.
| Company | Ticker | Close, USD | Daily change | YTD price return | 52-week range, USD |
| Microsoft | MSFT | 517.53 | +0.92% | +7.01% | 349.20 to 553.72 |
| NVIDIA | NVDA | 233.95 | +1.34% | +25.44% | 164.27 to 237.87 |
| Broadcom | AVGO | 355.14 | +3.35% | +2.61% | 289.96 to 495.00 |
| Taiwan Semiconductor Manufacturing | TSM | 472.78 | +2.96% | +55.58% | 266.82 to 479.00 |
| Apple | AAPL | 333.69 | +1.02% | +22.74% | 243.42 to 345.34 |
| ServiceNow | NOW | 134.38 | down 2.45% | down 12.28% | 81.24 to 192.97 |
| Palo Alto Networks | PANW | 403.24 | +1.76% | +118.91% | 139.57 to 409.50 |
| Texas Instruments | TXN | 293.80 | +4.44% | +69.35% | 152.73 to 334.03 |
YTD returns and ranges are from TGMCharts histories for MSFT, NVDA, AVGO, TSM, AAPL, NOW, PANW, and TXN. AVGO YTD return was cross-checked against WallStreetNumbers. A closing price does not show business quality. A watchlist can track the date, close, daily move, YTD return, 52-week range, next earnings date, and the reason for a sharp move. Compare the same dates and return type. Daily percentage change is the price move divided by the previous close, multiplied by 100. Total return also includes dividends.
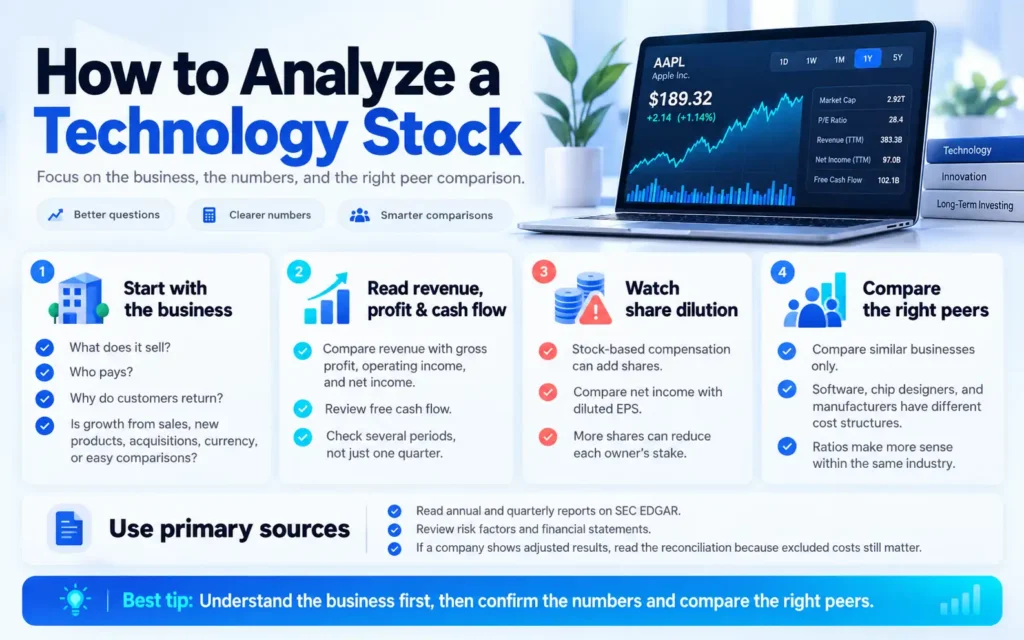
How to Analyze a Technology Stock
Start with the business. Identify what it sells, who pays, and why customers return. Check whether growth comes from sales, new products, acquisitions, currency, or an easy comparison year.
Read Revenue, Profit, and Cash Flow
Revenue is sales before expenses. Compare its growth with gross profit, operating income, and net income. Free cash flow usually means operating cash minus capital spending. Review several periods because one quarter can reflect payment timing. Stock-based compensation adds shares and can reduce each existing owner’s stake. Compare net income with diluted EPS, which reflects shares that could be issued.
Compare Companies in the Same Industry
Technology businesses have different costs. Software earns subscription fees, chip designers face product cycles, and manufacturers invest in plants. Compare similar businesses before applying ratios. Read company annual and quarterly reports on SEC EDGAR, including risk factors and the financial statements. Companies may also show adjusted results. Read the reconciliation because excluded costs still matter.
Compare Company Financials on the Same Basis
These figures were checked on October 3, 2026. TTM means the latest four reported quarters, so reporting end dates differ. Revenue growth is year-over-year. TSMC reports growth in New Taiwan dollars. EPS is diluted TTM earnings per share in USD. Shares outstanding are the latest reported counts and may differ from the weighted average shares used for EPS.
| Company | Revenue growth | Operating margin | Diluted EPS, USD | Free cash flow, USD billions | Shares outstanding |
| Microsoft | +17.79% | 46.78% | 17.95 | 66.99 | 7.43B |
| NVIDIA | +83.38% | 65.21% | 7.91 | 127.01 | 24.15B |
| Broadcom | +48.69% | 48.81% | 7.83 | 39.40 | 4.77B |
| Taiwan Semiconductor Manufacturing | +30.56% TWD | 56.08% | 13.44 | 35.94 | 25.93B |
| Apple | +14.24% | 33.17% | 8.72 | 136.68 | 14.59B |
| ServiceNow | +22.19% | 12.39% | 1.60 | 4.58 | 1.03B |
| Palo Alto Networks | +24.50% | 7.05% | 0.40 | 4.11 | 818M |
| Texas Instruments | +16.66% | 38.03% | 6.58 | 5.36 | 913M |
Sources: linked income statements for growth, margin, EPS, and cash flow; linked statistics pages for shares outstanding. StockAnalysis credits S&P Global Market Intelligence. Check the underlying SEC company filings. Growth measures sales change, operating margin shows operating profit as a share of sales, EPS is profit per diluted share, and free cash flow is operating cash less capital spending. Review share count changes because dilution can affect each share’s claim on results.
Check the Latest Company Earnings Reports
The TTM table is useful for comparison, but company results arrive on different schedules. Before publishing or making a decision, check the latest release and filing from Microsoft, NVIDIA, Broadcom, TSMC, Apple, ServiceNow, Palo Alto Networks, and Texas Instruments. Read the notes and segment data as well as the headline revenue figure.
How to Track Technology Stock Prices
Check the quote time, exchange, currency, daily change, volume, and 52-week range. Prices may be delayed, so refresh and timestamp the table before publishing. Price return excludes dividends; total return includes them. Compare a stock with a suitable benchmark and check its index rules. Screeners and portfolio tools help organize research, but check their data and methods.
Is an Investment in Technology Right for You?
An investment in technology can mean buying individual shares or a fund. Shares offer more control but depend heavily on each company. A fund spreads ownership, though a sector fund may still be concentrated.
For example, Vanguard’s VGT follows an information technology index. State Street’s XLK tracks technology companies in the S&P 500. Their rules and holdings differ, so check each fund’s fees, top holdings, overlap, and prospectus. A Best Technology ETFs & Technology Funds Guide can help compare holdings and fees.
The Federal Reserve’s 2022 Survey of Consumer Finances found that 58% of US families held stocks directly or indirectly, including through retirement accounts and funds. That does not show how many held more than $100,000.
Risks and Common Mistakes
Technology shares can fall when growth slows, or investors lower the price they will pay for earnings. Chipmakers face product cycles and factory costs. Software firms face competition and lost customers. Do not buy only because a product is popular, a price rose, or an analyst set a high target. Check your funds because they may already hold the same large tech companies. Diversification can lower company-specific risk, but cannot prevent all losses. Keep notes on what could change a company’s results. Follow Technology Company News & Market Updates for material changes.
Frequently Asked Questions
What is the best technology stock to buy now?
There is no best stock for every investor. Compare each company’s price, cash flow, growth, risks, and fit with your portfolio.
What percentage of Americans have over $100,000 in the stock market?
The Federal Reserve reported 58% of US families held stocks directly or indirectly in 2022, but that is not the share with more than $100,000 invested. The answer depends on whether retirement accounts and funds count.
Will tech stocks bounce back in 2026?
No one can know how prices will move next. Compare a named index over a stated period because sector indexes use different holdings. Past returns do not predict future gains.
Is it a good time to invest in technology stocks?
It depends on your goals, time horizon, risk tolerance, and valuation. Consider whether you could hold through a large drop.
What are the 5 most undervalued stocks right now?
There is no official list, and estimates change. Morningstar’s September 3, 2026 list used its fair value estimates. It is not personal buy advice.
Is it possible for the AI bubble to burst in 2026?
Yes. Shares could fall if sales or customer spending disappoint. Check whether AI sales produce cash and whether valuation assumes too much growth.
What are the top 3 stocks to buy now?
This guide does not rank stocks as buys. Microsoft, NVIDIA, and Broadcom have different business models. Compare their results, prices, and risks.
What AI stock is going to skyrocket?
No one can know. Review cash flow, competition, and valuation because investor expectations can rise faster than earnings.
Is Palantir worth buying now?
Palantir reported 149% US commercial revenue growth year over year in its second quarter 2026 presentation. Growth alone does not show whether its share price is attractive. Review cash flow, shares, and valuation.
Conclusion
Useful technology stock analysis connects dated price history with reported company financials. Compare revenue growth, operating margin, diluted EPS, free cash flow, share count, and valuation, then read the filing behind the numbers. Track the quote date and return type so the comparison stays fair. A research process cannot remove market risk, but it can make clear what you are measuring and why.


